
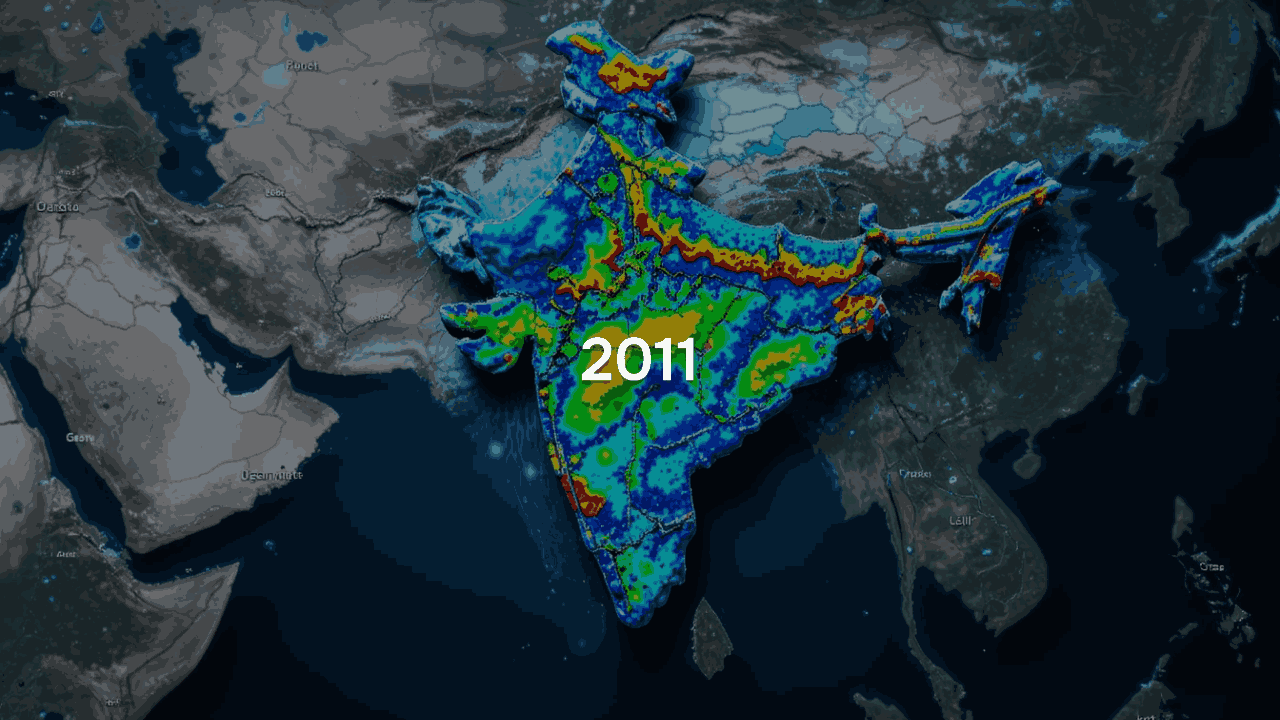
Surface Temperature 2011 India
This dataset contains surface temperature (TMP_surface) forecasts over India for the year 2011. The data includes 81 forecast time steps for each of the 365 daily observations, over a 256×256 latitude-longitude grid.
About Dataset
The dataset provides forecasted surface temperature (TMP_surface) data generated by the Global Data Assimilation System (GDAS) for the year 2011. It is structured as a four-dimensional array encompassing time steps, forecast lead times, and a regular latitude-longitude spatial grid. The temperature values are expressed in Kelvin and mapped over a defined geographic region. This dataset is valuable for a wide range of applications, including climate research, numerical weather prediction, environmental monitoring, and the development of AI-based models for atmospheric analysis.
How to Access the Dataset:
1. Review the Dataset Info Page
On redirection, you’ll land on a URL similar to:
Sample example: https://ardc.tropmet.res.in/thredds/dodsC/data/v10/gdas_2000_india_v10.nc.html
This page provides:
- Metadata: file size, variable names, and dataset conventions.
- Interactive Access Form: inputs for subsetting and extraction.
2. Locate the Variable of Interest
Scroll to the variable (e.g., VGRD_10maboveground) listed as a “Grid”. This is the dataset’s main content (e.g., wind speed, temperature, etc.). Check the box next to it.
3. Fill in the Data Subsetting Parameters
You must manually fill in five fields to subset the data grid:
- Time: Index of forecast issue date in the dataset. Use 1:1:2 to extract data from Jan 1 to Jan 2.
- Forecast_time: Indexes the forecast horizon. Use 0:1:80 to access all 3-hourly steps for 10 days.
- Latitude & longitude: Leave blank to extract full India coverage (default ~8°N–38°N, 68°E–98°E). You can enter ranges to subset, like 50:1:100 to access a slice.
- Variable selection: Ensure only one variable per card is selected to prevent data overload and errors.
4. Data Format Selection
At the top of the page, select:
- Get ASCII for plain text viewable in-browser or scripts.
- Get Binary for machine-readable scientific applications.
These generate the requested data instantly in the selected format.
5. Download the Output
After clicking “Get ASCII” or “Get Binary,” a new page or download will start. You can copy or save the returned raw data to your machine or pass the OPeNDAP link into software like Python (using xarray or netCDF4) for programmatic access.
Important Notes:
- Time and forecast_time are index-based (not real dates). Time = 1 refers to Jan 1, Time = 2 to Jan 2, and so on.
- Forecast_time ranges from 0 to 80 representing 3-hour intervals up to 10 days.
- This dataset contains a single forecast file per day, so only one “time” index should typically be active per request.
- Avoid selecting multiple variables on this form — each dataset card is designed for a single-indicator download.
 Dataset Metadata
Open Government License, India
India
Environmental Conservation and Sustainability
Ministry of Earth Sciences
-
Structured
Static
Hourly
01/01/2011 - 31/12/2011
23/07/25 06:44:39
Open
Hosted
 Activity Overview
 0
0 0
0  0
0  34
34
 Tags
Tags
- temperature
 License Control
Open Government License, India
© 2026 - Copyright AIKosh. All rights reserved.